It’s been a banner week for completely false, mostly false and downright disgusting propaganda to be posted across social networking sites. These following two memes came across my Facebook feed earlier this week.
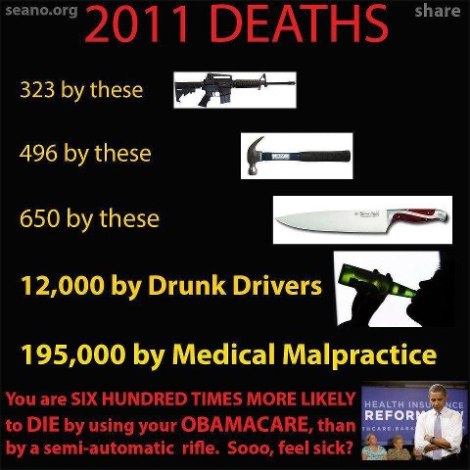
Meme 1:
Meme 2:

Both of them were posted by conservative Republican friends. And while both make me mad, the second one also sickens me.
But let’s look at Meme 1 first. Aside from being misleading and plain wrong on many points, the intent appears to be to try and suggest that Americans should not attempt to have serious gun control talks. Why? Because more people are killed by hammers, knives, drunk drivers and medical malpractice. Well, this is not a very convincing argument; at least not to me. As an aside, let me also say, given that every household in the country has at least one hammer, I’m surprised that they are not used in more murders.
Anyway, the gun meme is, at least partially, taken from published FBI statistics (http://www.fbi.gov/stats-services/crimestats). There were 323 reported rifle deaths in 2010, but FBI statistics do not track semi-automatic vs. regular rifles as the meme suggests. In fact, the FBI does not track semi-automatic weapons deaths as its own subcategory for any firearm. Instead of 650 deaths by knives, the FBI statistics report 1,694 deaths by knives or cutting instruments. The FBI statistics do not delineate how many deaths by hammer, though they do report the number of deaths by hands, feet, fists, etc. and this figure is 728. According to MADD (Mothers Against Drunk Driving), there were 9,878 drunk driving deaths in 2011, not 12,000. The 195,000 figure for estimated medical malpractice deaths is widely reported and, admittedly, disturbing, but despite the ginormous number, this data is from one study completed in 2004 (before President Obama took office) and covers 37 million hospitalizations (death rate of 0.5%). Nonetheless, the figure has nothing to do with Obamacare (such a pejorative term) and no one person is 600 times more likely to die by medical malpractice than by semi-automatic rifle or any other weapon. This is just an uneducated interpretation of data. But even worse, the meme does not say that there were 8,583 total firearm deaths in 2011 according to the FBI. I would add that the CDC reported this figure at just over 11,000 in 2010.
Meme 2, the totally classless meme comparing lynchings and abortion, is offensive. First, the number of lynchings was most certainly underreported. Scholars tend to concur that this number is low due to the fact that it was compiled by Tuskegee Institute based on lynchings published in newspaper articles. It seems hard to believe we lived in a time where lynchings were so normal that they were actually published in the newspaper (see below) but surely not every lynching made its way into the newspapers.

Re the picture: I especially like the guy just to the right of the hanging bodies (the “gentleman” with a dead man’s head on his shoe) who is grinning ear-to-ear (NOT!). At least the young man in the extreme right foreground has the common decency to look bewildered….but wait, is that a big ole stogy in his hand? Oh, yes, before stogies were passed out to celebrate the birth of babies, they apparently were used in post lynching revelries.
So, why do I think Meme 2 was created? I think the creator and the people who forward this would admit to the purpose of showing the hypocrisy of being anti-lynching and also being pro-choice, but I’m sure they would not even register the underlying racism. Look, I totally understand the moral objection to abortion. But the analogy in this meme just does not hold up for me. If you could show me a picture of a group of women celebrating and posing for a picture over aborted fetuses, then maybe I could see the analogy. But the fact is that what drives these two acts is totally different. Maybe you can see what I see in the picture above: A bunch of white men in suits who have no problem killing someone’s brother, father or son out of hatred and bigotry. These same white men in suits even today would attempt to force a woman to bring a child into the world, regardless of the circumstances under which the child is conceived and regardless of whether the child can be adequately provided for or loved, and perhaps even if the woman’s life was in danger. There are several white men in suits who want to prosecute women who are raped and have an abortion without the consent of the “father”. At the same time, these white men in suits refer to the mothers who actually DO keep their babies as “welfare moms” and try and eliminate as much assistance to them as possible while giving the men who created the babies a free pass.
As I said, the reasons for each of these actions – lynchings and abortions – could not be more different. One is perpetrated out of hatred and perceived racial supremacy while the other is done out of fear and desperation and often with much sadness. These two acts cannot balance on the scales of justice or morality or whatever higher creed a person adheres to.
While I will not get into the biblical support for either the pro-life or pro-choice position, I will say that I am a Christian, I have read the bible, and I can reconcile being able to support a woman’s right to choose with scripture; similar to how proponents of the death penalty can reconcile this act with their interpretation of the Bible. In my opinion, abortion is a personal decision between the woman, possibly her family, and even the father if he is willing to take part in the decision making process. These are the only people who should be involved and only God can be the judge.
To allow religious leaders to set public policy is to be on the path of many of the governments that are controlled by religious zealots. These are the same types of repressive regimes that we try and depose. Remember, the Bible condemns divorce and commands that children who curse their parents be put to death. Neither divorce nor cursing parents is illegal in the U.S., but they incur the same Old Testament punishment that abortion would if God considers abortion murder, and that is death.
If, however, our society as a whole decides that abortion is something that they cannot live with and abortion becomes illegal, I do hope that the people who will have worked so hard to repeal abortion rights will work as vigorously to ensure that the children born have every opportunity not only to life but also to liberty and the pursuit of happiness. I won’t publish the pictures of children tortured, killed, abused, maimed and permanently damaged both physically and emotionally due to the system that wants so much to see them make it into the world but then turns a blind eye and a deaf ear to them after they are born, but I urge you to do an internet search so you can see those faces.
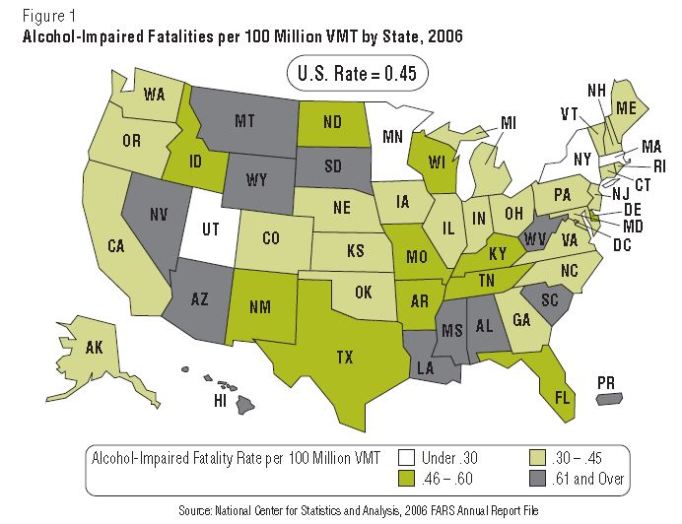
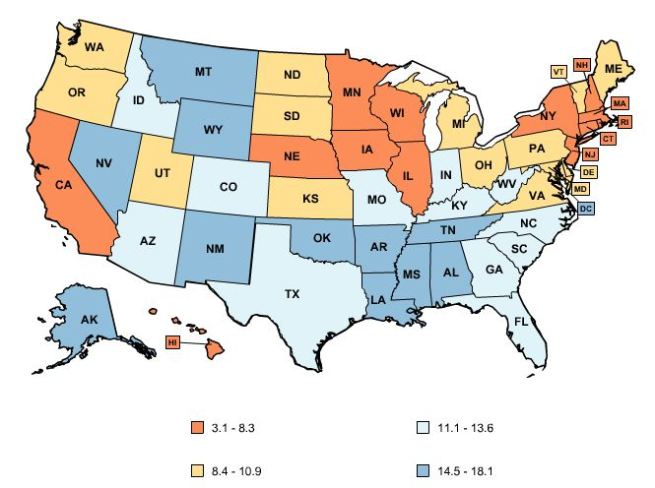
Finally, I would like to point the reader to some other statistics that I found which should illustrate how things are not always as they seem in regards to who is in the “right” and who is not. First is a map showing impaired driving fatality rates for each state prepared by the National Highway Transportation Safety Administration. The second is a map showing which states voted for which party in the 2012 presidential election. The third map shows gun deaths in each state prepared by www.statehealthfacts.org from data compiled from CDC data.

Note: I have tried to find the most recently compiled data from each category. While they may not be from the same year, they are close enough to show trends. Also, if any of you find data that you think refutes, questions, or supports this data and you would like to share, I will research it and incorporate it into the post as an update.
Facts:
Only two states with the highest drunk driving fatalities, Nevada and Hawaii, voted Democrat in the 2012 election. The remaining nine voted Republican. They are Arizona, Montana, Wyoming, South Dakota, Louisiana, Mississippi, Alabama, West Virginia and South Carolina.
Two of the states with the highest firearm fatalities, Nevada and New Mexico, voted Democrat while the remaining nine voted Republican. They are Alaska, Wyoming, Montana, Oklahoma, Arkansas, Louisiana, Mississippi, Alabama and Tennessee.
|
Statistic Measured
|
Number of Democrat States
|
Number of Republican States
|
|
Highest Drunk Driving Death Rates
|
2
|
9
|
|
Highest Firearm Death Rates
|
2
|
9
|
|
Party Winner
|
|
Republicans Win!
|
Only one of the states with the lowest drunk driving fatalities, Utah, voted Republican while the remaining three voted Democrat. Those three were New York, Massachusetts and Minnesota. They deserve a big hand since there were so few of them.
Only one state with the lowest firearm fatalities, Nebraska, voted Republican while the remaining 12 voted Democrat. These states were California, Hawaii, Iowa, Minnesota, Illinois, Wisconsin, New York, New Hampshire, Massachusetts, Rhode Island, Connecticut and New Jersey.
|
Statistic Measured
|
Number of Democrat States
|
Number of Republican States
|
|
Lowest Drunk Driving Death Rates
|
3
|
1
|
|
Lowest Firearms Death Rates
|
12
|
1
|
|
Party Winner
|
Democrats Win!
|
|
Six states that scored just at or below the national average for drunk driving fatalities voted Republican while 18 voted Democrat.
Four states that scored just above the lowest levels of gun deaths voted Republican while ten voted Democrat.
|
Statistic Measured
|
Number of Democrat States
|
Number of Republican States
|
|
Next Lowest Drunk Driving Death Rate
|
18
|
6
|
|
Next to Lowest Firearm Death Rate
|
10
|
4
|
|
Party Winner
|
Democrats Win!
|
|
Four states that scored above the national average for drunk driving fatalities but not at the top voted Democrat while seven voted Republican.
Two states that scored above the national average for firearms deaths but not at the top voted Democrat while ten voted Republican.
|
Statistic Measured
|
Number of Democrat States
|
Number of Republican States
|
|
Next to Highest Drunk Driving Death Rate
|
4
|
7
|
|
Next to Highest Firearm Death Rate
|
2
|
10
|
|
Party Winner
|
|
Republicans Win!
|
RECAP
|
Statistic Measured
|
Number of Democrat States
|
Number of Republican States
|
|
Highest Drunk Driving Death Rate
|
6
|
16
|
|
Highest Firearm Death Rate
|
4
|
19
|
|
Lowest Drunk Driving Death Rate
|
21
|
7
|
|
Lowest Firearm Death Rate
|
22
|
5
|
So, I ask you this: Who is pro-life in practice?
Yes, I know that there are going to be those that consider themselves pro-life that will say, but what about the 50 million abortions that have been performed since the passage of Roe v Wade and how many lives could be saved if we repealed Roe v Wade. To those people, I say this:
Using the above data coupled with the independent research facilities Guttmacher Report of 2003 which said the CDC estimated that there were an additional 100,000 illegal abortions performed in 1972 before Roe v Wade, an estimated total number of abortions in 1972 is 686,760. This is just about 138,804 less than reported in 2008 by the CDC.
Further, based on the 50,000,000 estimate, the average number of abortions per year is approximately 1,280,000 (a high number going forward as abortion numbers have decreased, but I’ll use it for illustration). There were already approximately 670,000 abortions performed before Roe v Wade. Therefore, only approximately 24,000,000 of that 50,000,000 can be attributed to Roe v Wade if the most liberal numbers are used. And considering that about 15% – 20% of all pregnancies end in miscarriage, then that number would be below 20,000,000, I am not marginalizing that figure. It is huge. But so is the cost to society of unwanted pregnancies. But back to the point. If the number of abortions continue to remain near pre-Roe v Wade numbers, then the supposition that Roe v Wade has caused such a rise in abortions is moot unless the pro-life movement not only wants to strike down Roe v Wade but also wants to go further than what existed prior to Roe v Wade; i.e., they want to take away the individual states’ rights to determine whether they would allow abortions and under what circumstances.
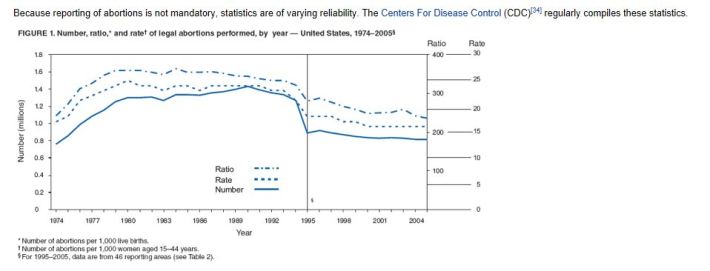
The following graph shows even more clearly how the number of abortions has declined since a high in 1989/1990 to about where they were when Roe v Wade was passed.
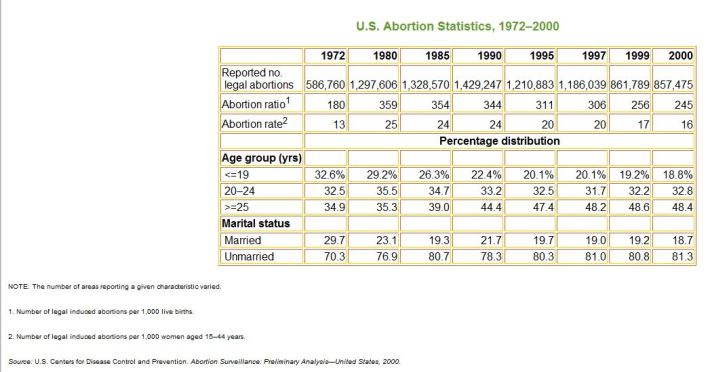
And the information in the following spreadsheet is especially interesting.

This spreadsheet shows WHERE abortions are occurring. Based on total numbers, New York is Number 1. Its abortion rate is equivalent to 0.7% of the total population (using 2000 US Census data.) Second by numbers is Texas with abortions equivalent to 0.4% of total population. Third by numbers is Pennsylvania with abortions equivalent to 0.3% of its population. Coming in at a relative deadheat for fourth by numbers is Georgia (.4% of population), North Carolina (.4% of population), and Ohio (.3% of population.) Fifth by numbers is Michigan with abortions equal to .3% of population.
So, the Democrat state of New York is definitely leading the pack in abortions by number and percentage of population. However, it should be noted that abortion is LEGAL in the United States and it was legal in New York before Roe v Wade. Even so, it is very interesting to note that the Republican states of Texas, Georgia and North Carolina actually have a higher percentage of abortions than the other states rounding out the top five AND Texas has the second highest total number of abortions behind New York.
So, please understand if I do not always take very seriously what Republicans eschew when it comes to pro-life matters, especially in their clever memes. For life and death issues that are against the law, such as killing with firearms and deaths from drunk driving, they are the absolute worst – not even close. And for abortion, which is legal, they still have the three next highest abortion percentages. They are as bad or worse than the rest of us.
And to be clear, the purpose of THIS analysis is not to bash Republicans for their ideals. If Democrats were posting this propaganda, I would be calling them out on it (again, if you find evidence of similar Democrat memes, forward them to me, I’ll comment.) I have lived all over the United States. I have lived in the very Democrat leaning states of California and Connecticut and the very Republican leaning states of Texas and Tennessee. I have also lived in one of the most conservative areas of Michigan (Berrien County) and one of the most liberal areas of Michigan (Ann Arbor.) I have had the opportunity to see local and state politics of all sorts. I have friends and family that are staunch Republicans and those that are staunch Democrats. I have, for approximately the last 20 years, considered myself an Independent. But I cannot divorce myself from right and wrong and fact and fiction based on a party affiliation.
I understand that we all make mistakes and despite our best efforts to be error free, we will sometimes have to eat crow, but my observations in these paragraphs are more about the irresponsibility of people who continually post things that are not based in fact….even remotely. It is about people who carelessly forward information that they have not even attempted to verify. It is about my complete loss of faith in the average American to disseminate information. Worse, it is because I am beginning to realize that people I know, some of whom I have looked up to and admired, don’t even seem to care whether what they post or forward is inaccurate, distasteful, unintelligent, racist, hateful, mean, offensive, devisive without a purpose, or utter lunacy. Although I didn’t go into detail here about the 30 minute video I received from the lunatic fringe regarding Sandy Hook being a liberal conspiracy, THAT would be an example of utter lunacy!
And in the words of Forrest Gump, “that’s all I’ve got to say about that”…..for now.
P.S. I apologize for the quality of several of the graphs. I am sure that I will figure out a way to link directly to the source at some point, but for now, saving and then inserting them often reduces their clarity.
Additional Note: The FBI statistics are murders and do not include accidental deaths or suicides caused by firearms or any of the other weapons.


